Market Statistics
Accurate, local market data from OneKey MLS
Our market statistics are based on real sales data from one of the state’s largest multiple listing services—helping you make informed homebuying decisions.
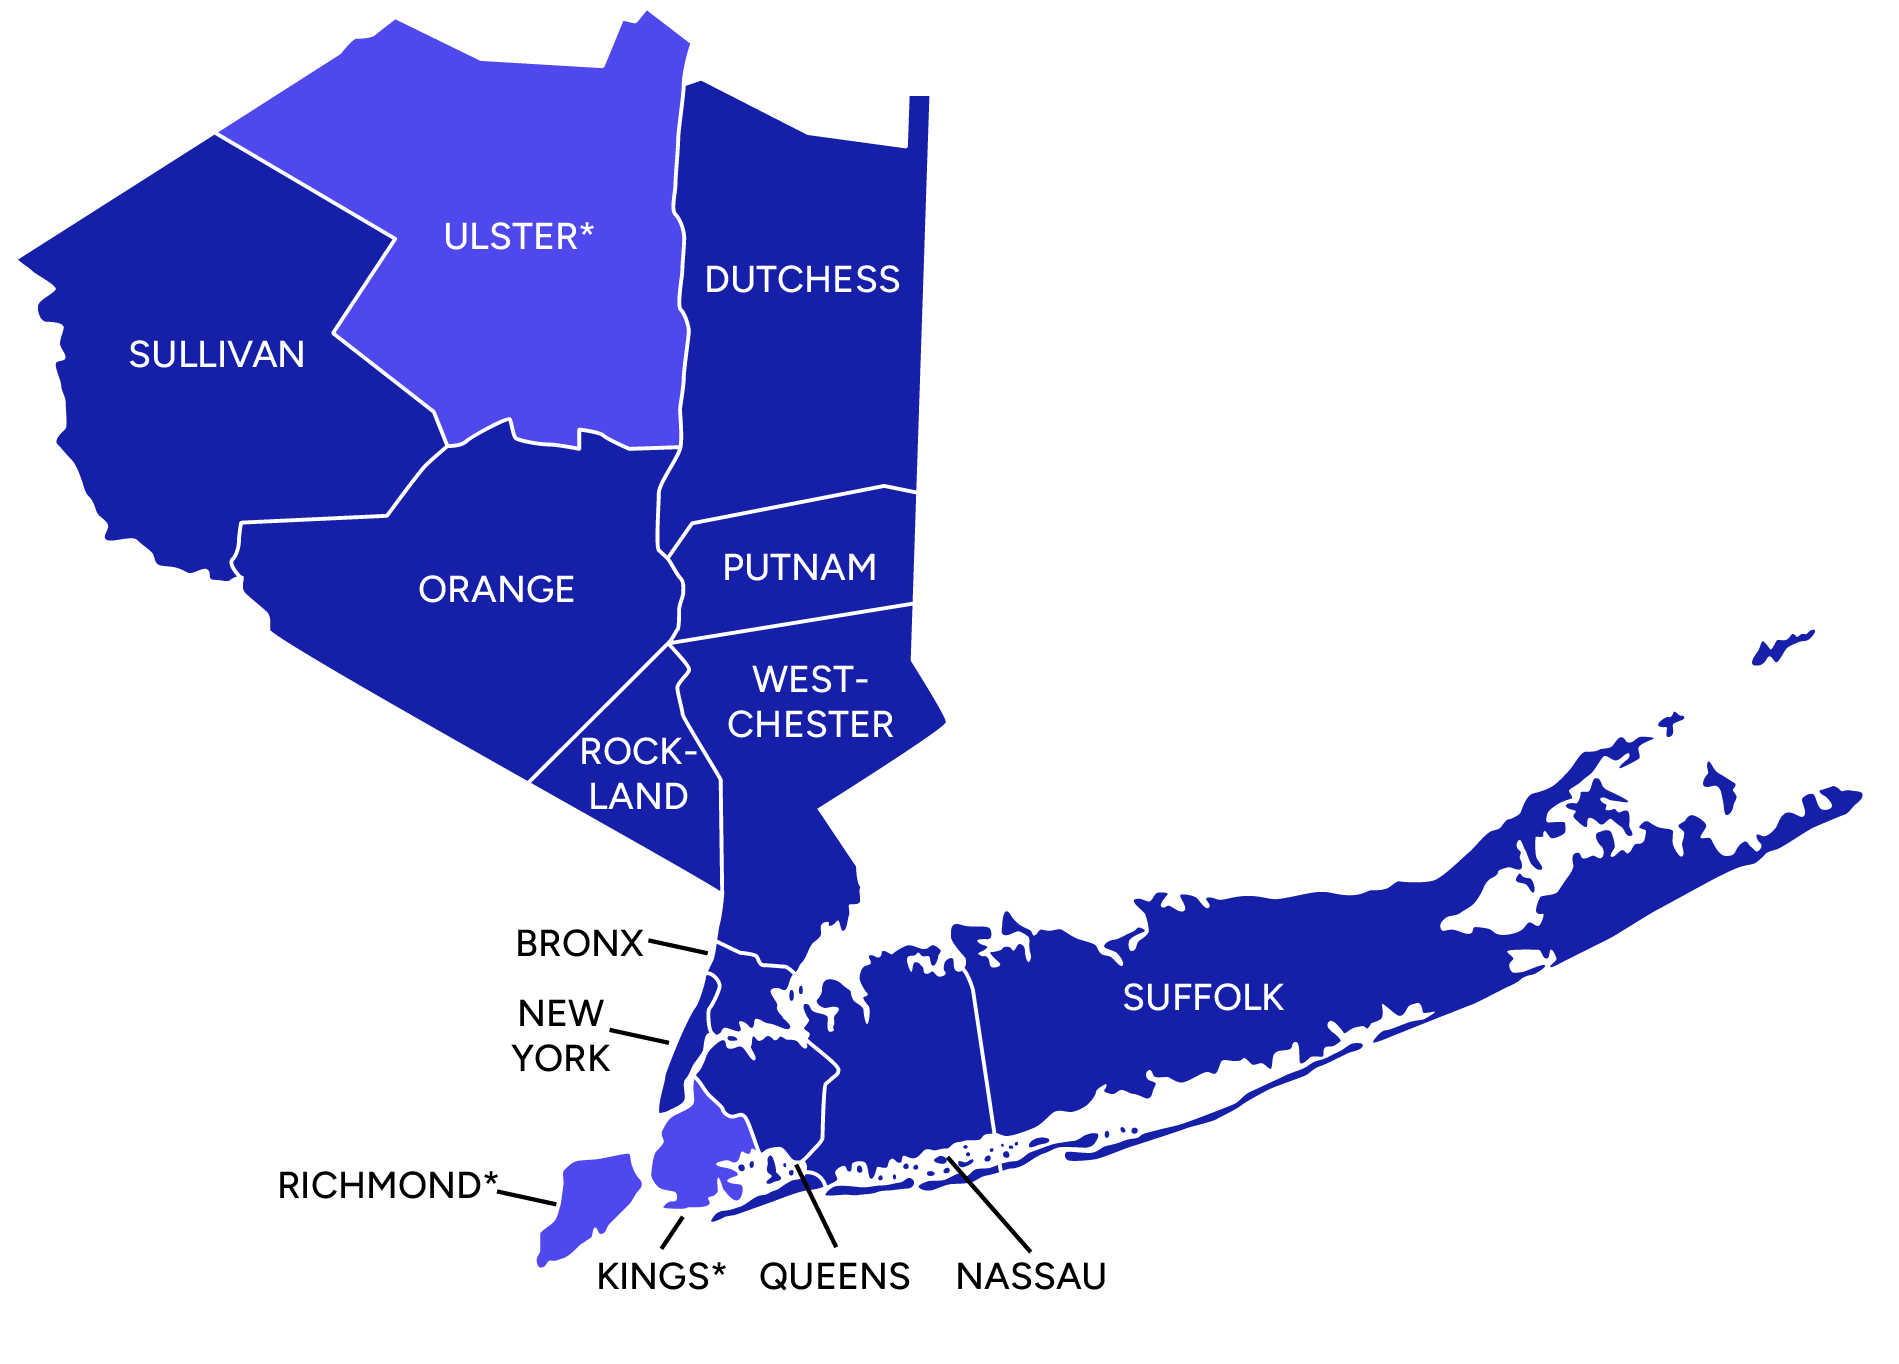
We publish monthly and quarterly reports that feature trends in closed and pending sales, along with other key metrics. Below, you’ll find the most recent reports and historical data for communities including Bronx, Brooklyn, Dutchess, Nassau, Orange, Putnam, Queens, Rockland, Suffolk, Sullivan, Ulster, and Westchester counties.
Whether you’re a real estate professional or a homebuyer, our team is always available to answer your questions.
*Not exclusively part of OneKey MLS regional coverage area.
See current market reports
Interested in seeing older market statistics and data? See our reports archive.
OneKey MLS regional home sales
June 2026 year-over-year comparisons of single-family home sales closed median home prices
Source: FastStats
Dutchess
$570,000
$496,875
+14.7%
Westchester
$1,341,500
$1,200,000
+11.8%
Suffolk
$750,000
$700,000
+7.1%
Orange
$499,950
$477,500
+4.7%
Rockland
$823,000
$776,500
+6.0%
Nassau
$875,000
$850,000
+2.9%
Putnam
$626,000
$615,000
+1.8%
Ulster
$440,000
$435,000
+1.1%
Bronx
$680,000
$675,000
+0.7%
Queens
$880,000
$875,000
+0.6%
June 2025
County
June 2026
Change
Sullivan
$350,000
$360,000
-2.8%
All S/F Closed Median Home Prices are generated by FastStats
County statistics 2026
Regional market update
Interested in seeing older market statistics and data?
Media inquiries
If you are a member of the media or would like to schedule an interview with OneKey® MLS’s real estate experts, please email or call Richard Washington at: